If you have been around OpenStreetMap Ireland for a while, you might be aware of the Buildings Project which was kicked off in November 2019 in Kilkenny. This conveniently came just before the country went into lockdown which had everyone stuck at home and somewhat bored. At the time, we made very quick progress with the mapping of buildings, because we had many contributors who spent a lot of time at it. Sadly, but probably fairly unavoidably, this level of motivation did not last. Some of us have kept at it, though, so there is still progress which you can read about in the blog posts published after every task is “finished” (a mapper’s work is never done, though).
HeiGIT offers some amazing tools to analyse the state of your chosen map1, so here are some graphics (created in QGIS) to show our progress in trying to get all the buildings of Ireland onto the map:
(1 Because the counties in Northern Ireland have been “downgraded” to historical boundaries, they cannot be chosen for the analysis.)
Mapping saturation
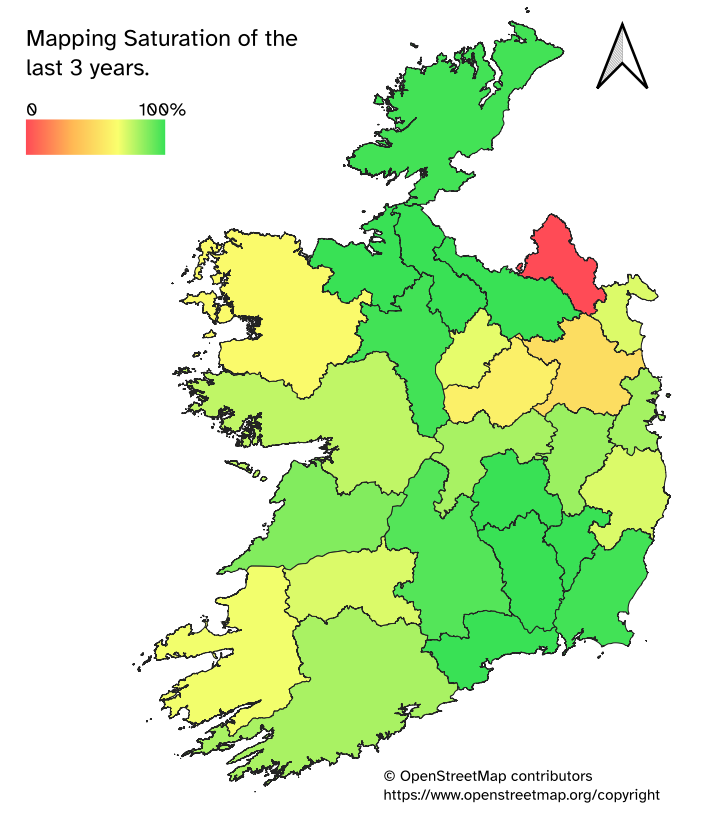
Before you start panicking about Monaghan – we did actually map the buildings there; the Monaghan task was finished only 11 months ago. This is probably why the analysis tool gives a somewhat false negative. A look at the graphs explains it a bit better:
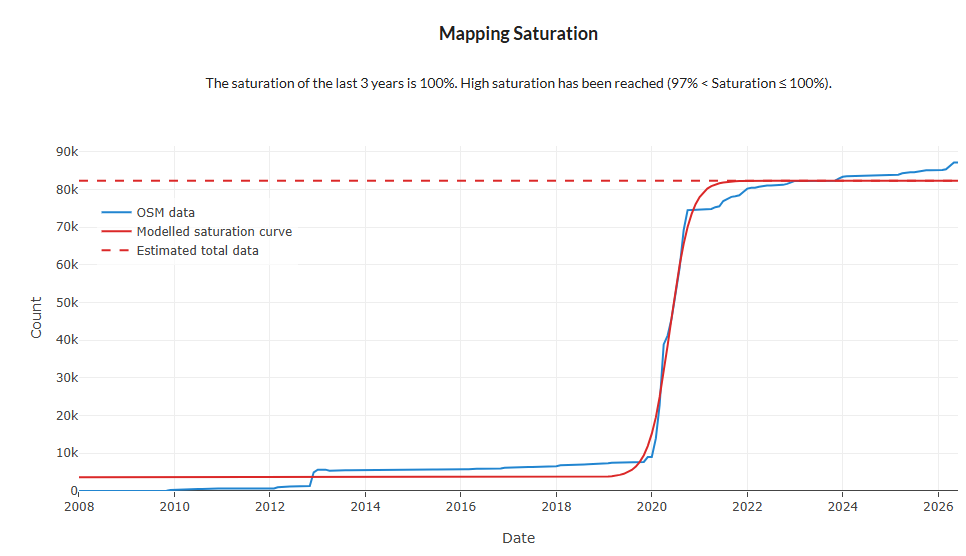
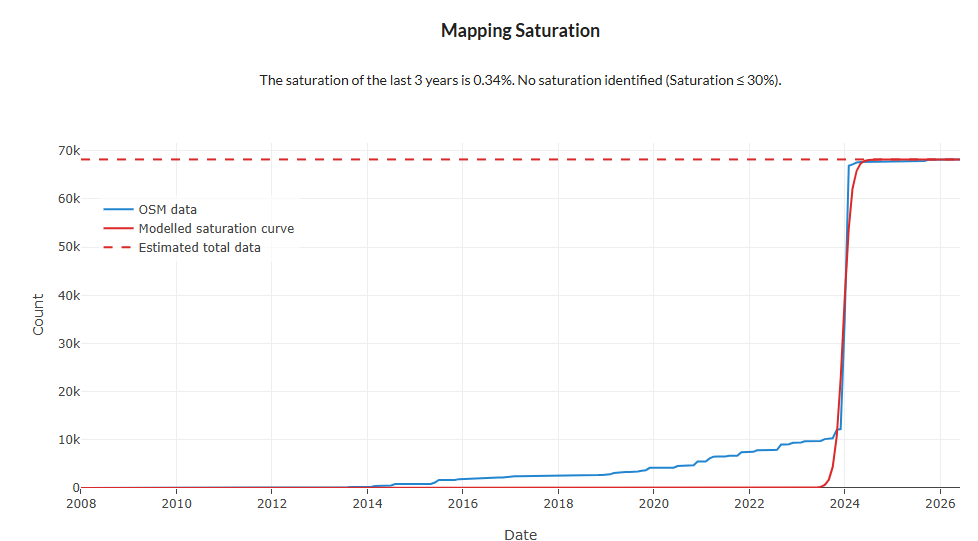
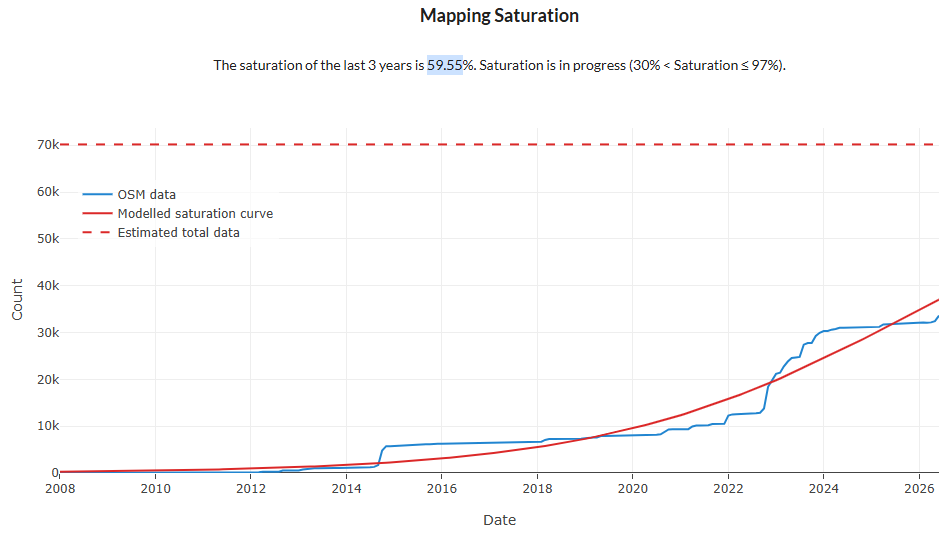
The County Waterford task was one of the early ones to be complete. The blue graph representing the OSM data crosses the estimated total data line pretty much exactly three years ago. In the Monaghan task, on the other hand, the OSM data seems to be slightly below the estimated total data and only reached that point within the last two years. Compare that to County Westmeath which had a task created in 2019, but hardly any work was done on it. It will probably be the next task to be opened after the SW Limerick task is finished.
The Ohsome OSM History Analyzer also allows for looking at the currentness of data, provided there is not too much data for it to analyse:
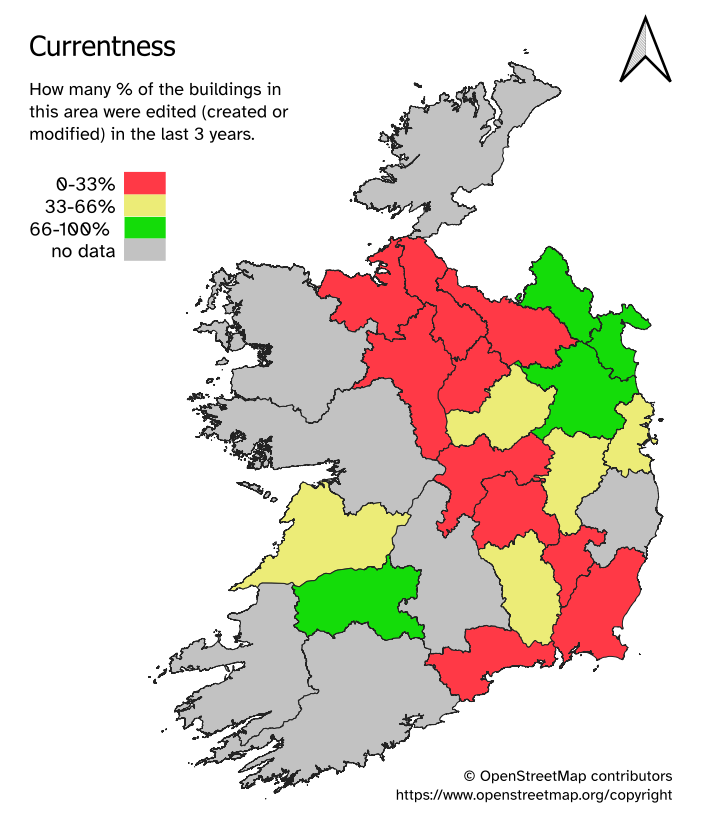
Monaghan’s honour has been restored. They HeiGIT tool actually shows the data for the last three years AND for between three and eight years ago, so above map is very much a simplification. What it does show, though, are areas that have not been touched much in the last three years, usually after their mapping task was completed, because nobody seems to have an interest in mapping buildings there. It is a pity that the tool did not provide data for most of the counties affected by our Wild Atlantic Way mapping.
Attribute completeness
One of the reasons to start the buildings project was that it would make address and POIs (businesses etc) mapping easier and more precise. However, a comparison of the two maps shows that even though most of the buildings in Leitrim, Cavan, Roscommon and Sligo are mapped, there seems to be very little uptake in adding addresses or POIs to those buildings. Since we are not in a position to import this data like other OSM chapters are, it requires people on the ground to add the information. HeiGIT has an tool for completeness analysis, too:
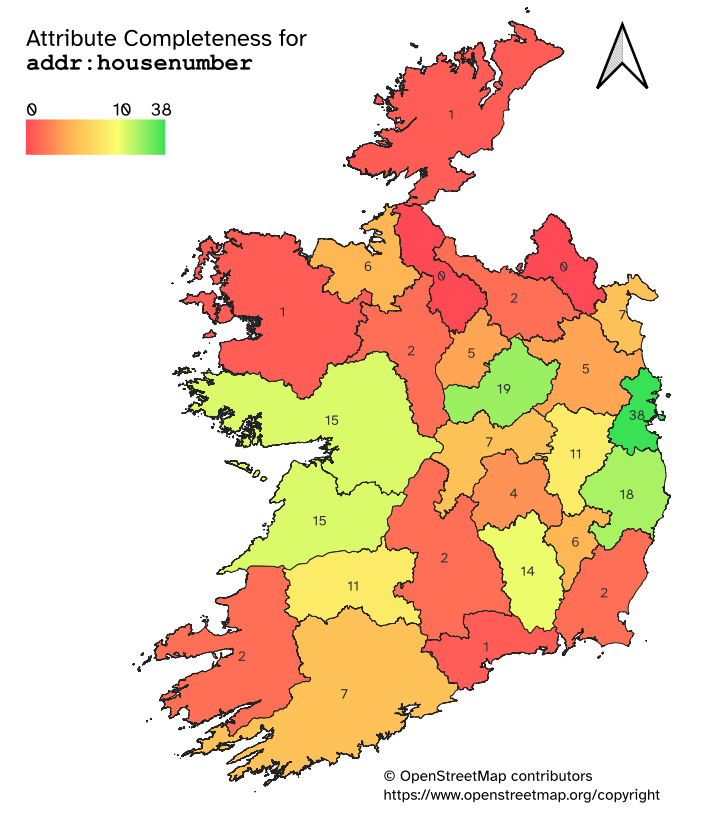
addr:housenumber applied to building geometry.Since I have personally added A LOT of house numbers in County Kilkenny, I decided that anything over 10 was a good enough value, bearing in mind that house numbers usually only apply in urban areas, if at all. The value for Westmeath is also deceivingly good, because the analysis shows the ratio of addr:housenumber on mapped buildings, so if there are fewer buildings mapped, but those that are have house numbers, the value will be higher. Presumably this analysis also skips addr:housenumber mapped as a node rather than on the building geometry. So, take this map especially with a couple of grains of salt.
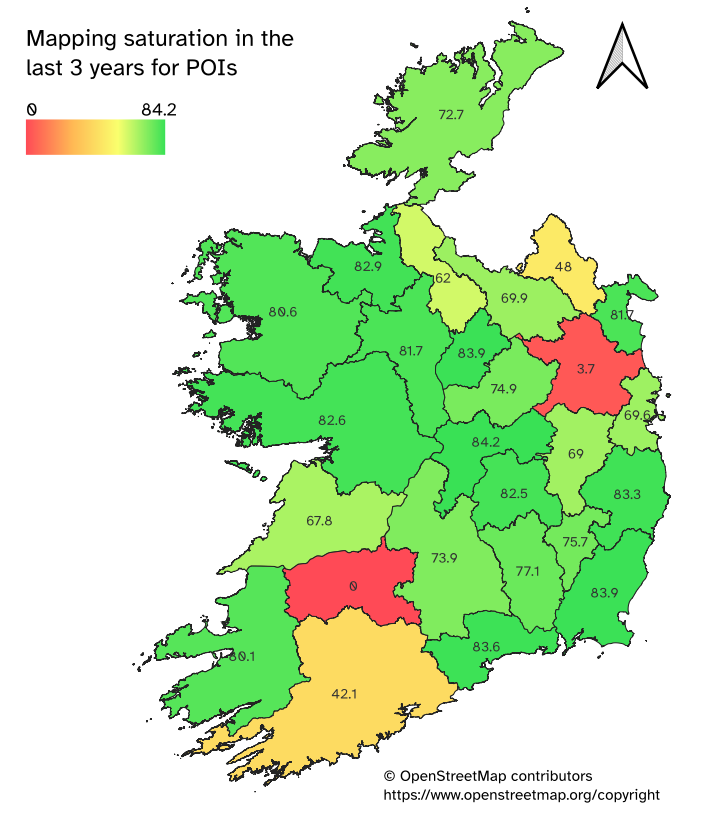
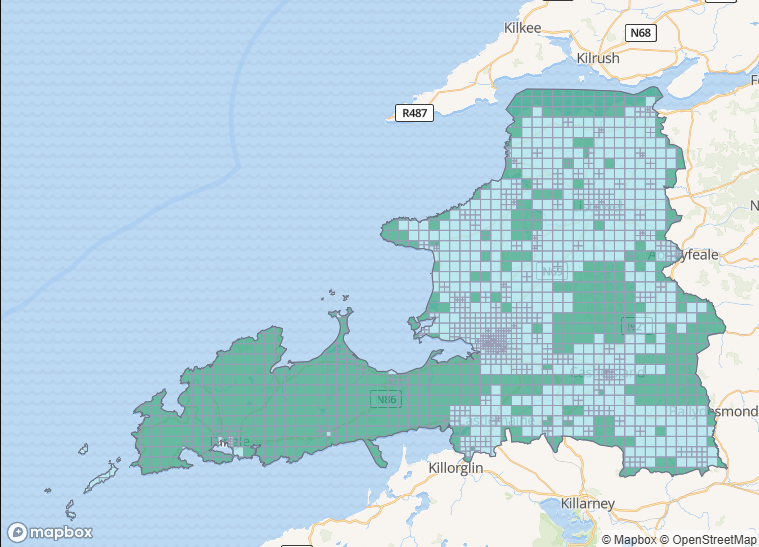
The HeiGIT tool can also analyse the saturation of POIs which leads to interesting results in Limerick, Cork and Meath. Since I am working on mapping SW Limerick at the moment and use street-level imagery in the larger settlements, this should improve, if we ran it again in a year’s time. I have no explanation for the disappointing performance of County Meath. The mapping of certain amenities can benefit from tourist mappers which might play a role in some of the western counties and other spots popular with tourists.
If everyone who has better geo-analysis skills than me wants to add a few maps, please feel free. All in all, I think we are on the right way, but we need more dedicated mappers overall or the possibility of open data import. Or another lockdown, ehem.
Thank you to all the people who have contributed so much in the last years! Keep her lit!
0 Comments