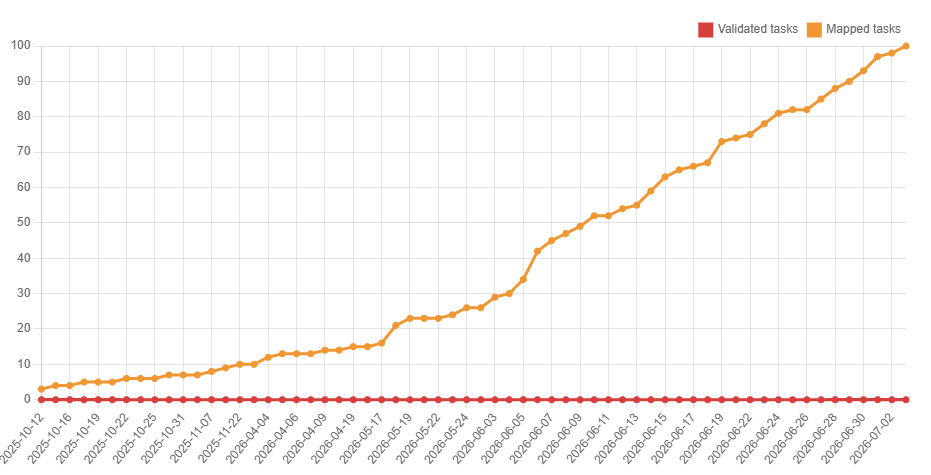
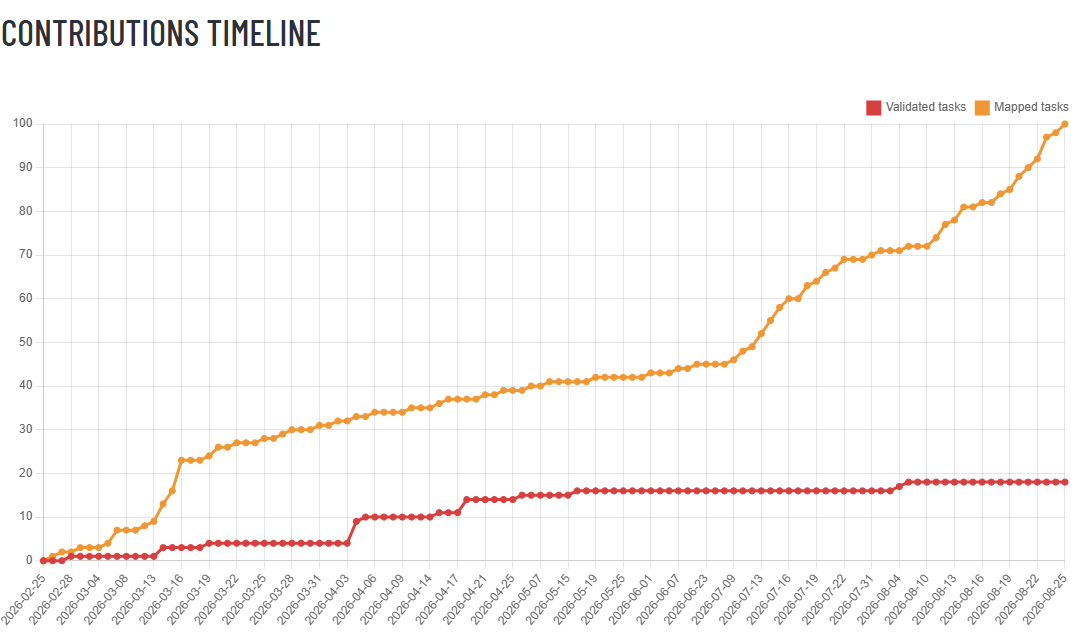
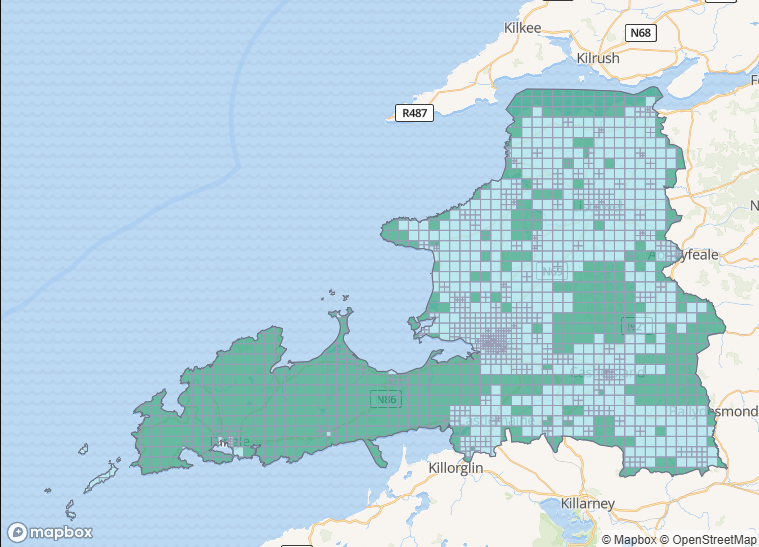
On July 3rd, the SW Limerick task (#114) had been finished mapping on the task manager. Five contributors had worked on the task with b-unicycling having mapped 1055 and validating 2 tasks, jonnymccullagh having mapped 2 tasks and craghead having validated 2 tasks. The other two contributors worked on the tasks without completing a tile. Many thanks to all involved.
The imagery used was the quite outdated, but crisper Esri Clarity, the newer Esri World and for place names and historic features the 2nd edition 6inch OS map. 28 potential “new” (i.e. unrecorded by the National Monuments Service) archaeological features were spotted. The reports to the NMS were sent, but no confirmation has been received yet. In addition to the aerial imagery, b-unicycling used Bing StreetSide imagery to map details (building levels, street furniture etc) in more condensed settlements.
Building statistics
| tag | No. 10/10/2025 | No. 04/07/2026 |
|---|---|---|
building | 12K | 55K |
building=yes | 4K | 14.8K |
building=house | 5.7K | 22.2K |
building=terrace | 7 | 3 |
building=apartments | 0 | 0 |
building=residential | 94 | 50 |
building=garage | 295 | 3,100 |
building=shed | 495 | 3,100 |
building=greenhouse | 13 | 95 |
building=farm | 2 | 5 |
building=farm_auxiliary | 587 | 10,600 |
building=commercial | 59 | 99 |
building=industrial | 96 | 116 |
building=retail | 232 | 343 |
building=public | 7 | 8 |
building=school | 42 | 63 |
building=church | 44 | 59 |
building=ruins | 61 | 321 |
roof:material=thatch | 10 | 28 |
building:levels | 662 | 1,600 |
addr:street | 1.9K | 2.6K |
Other statistics
Note: Some of these may of course have been added by mappers on the ground.
| tags | No. 10/10/2025 | No. 04/07/2026 |
|---|---|---|
highway | 2,744 km | 3,536 km |
highway=crossing | 66 | 100 |
traffic_calming | 54 | 90 |
highway=street_lamp | 74 | 217 |
amenity=bench | 53 | 69 |
amenity=post_box | 10 | 17 |
power=pole | 10.4K | 11.2K |
man_made=mast | 28 | 39 |
barrier=hedge | 146 km | 247 km |
barrier=wall | 37.6 km | 124 km |
Mapping saturation
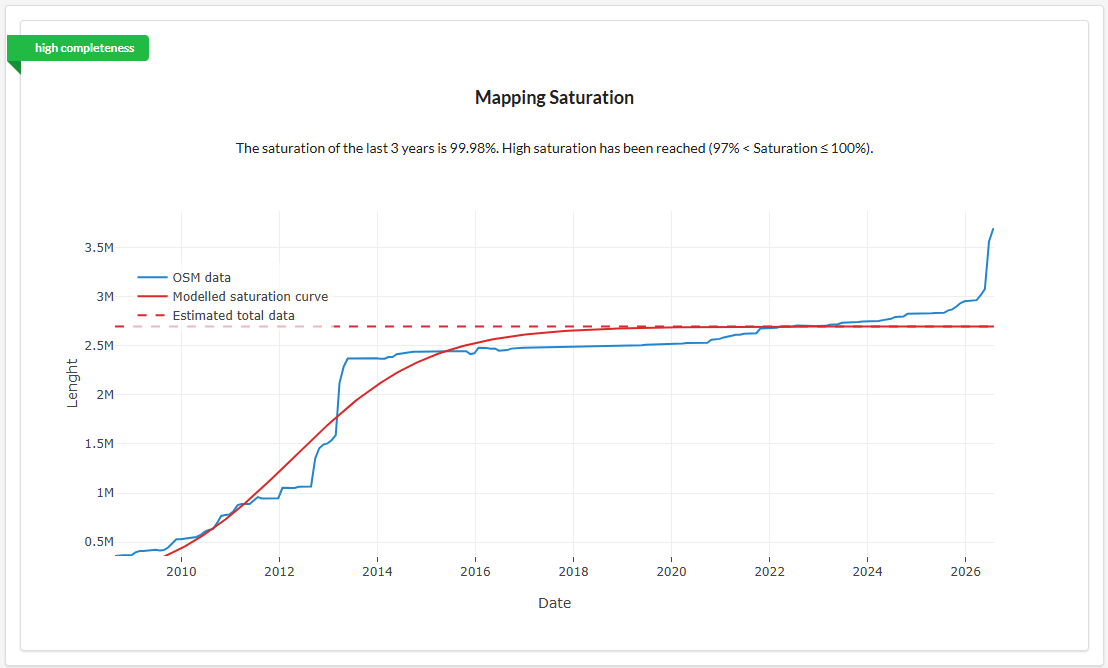
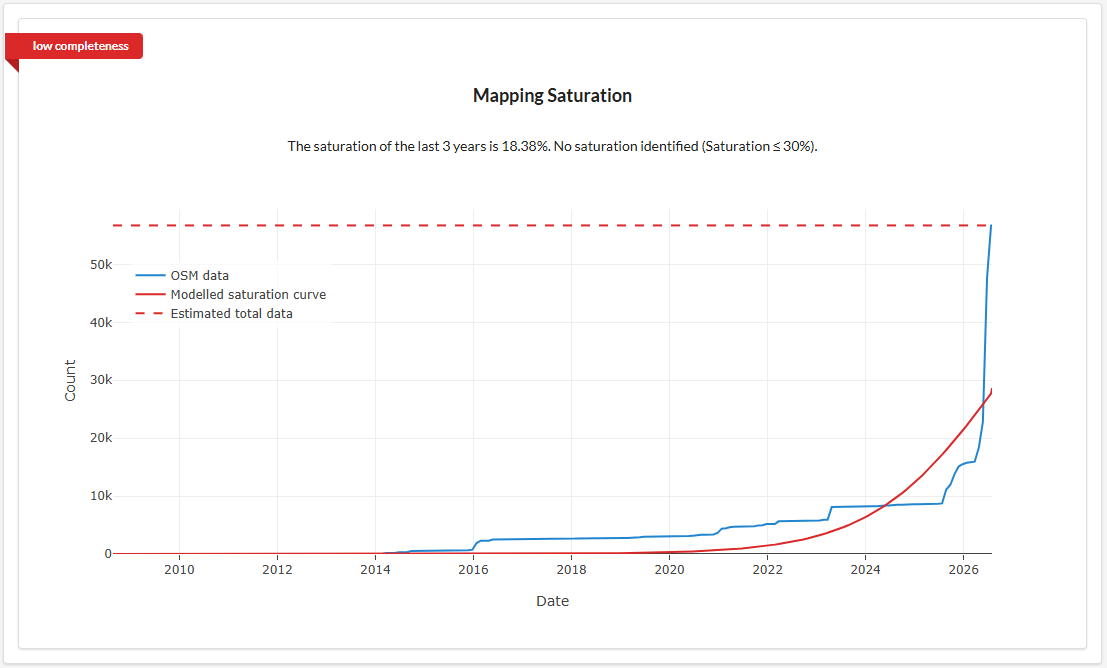
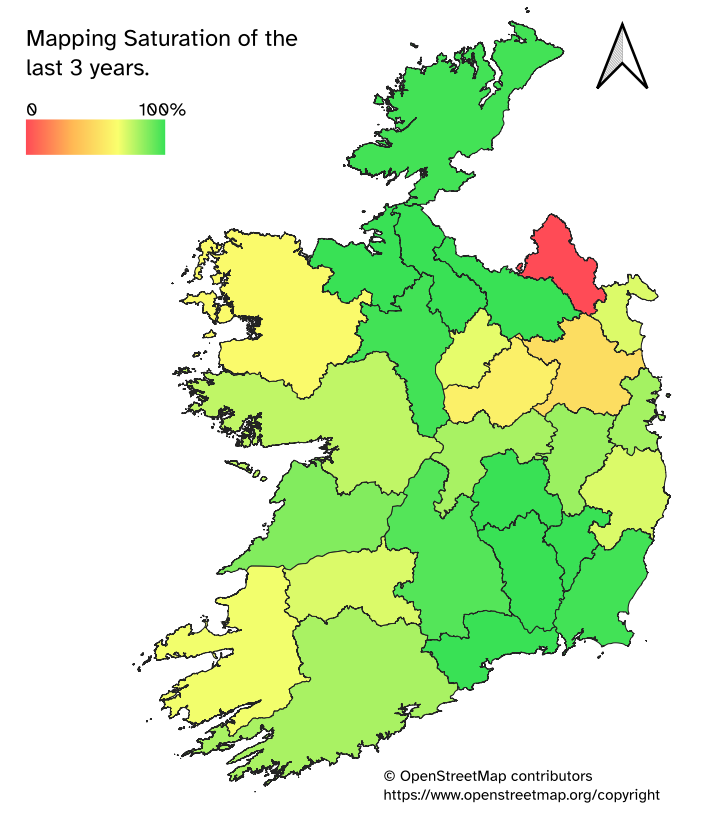
Using the analysis tools on https://dashboard.ohsome.org/, the saturation has unsurprisingly improved in the last years for the area of SW Limerick. Both highways and buildings seem to have exceeded their prediction, and even though the verdict “low completeness” for buildings sounds harsh, the curve shows that the estimated total data has been reached.
0 Comments